Your next stock pick deserves a deep dive.
Comprehensive equity research, generated in minutes — not weeks. Financial analysis computed by code from real filings and market data — not generated by AI. Valuation sensitivities you can adjust. Your choice of leading AI model for qualitative insight.
No credit card required. No subscription. Pay only for what you use.
Built on SEC filings · institutional-grade financial databases · earnings transcripts · real-time market data
Stop relying on someone else's thesis
Conflicted recommendations, scattered data, and opaque AI tools have been the default for too long. EquityDive puts comprehensive, transparent analysis directly in your hands.
- Scattered data across dozens of tabs — no single source of truth
- Generic AI tools that confidently hallucinate financial numbers
- Advisors charging a percentage of AUM for recommendations you can't verify
- Analyst reports with more disclaimers than actionable insight
- Enterprise terminals at enterprise prices — still no cohesive single report
- Newsletters and stock tips designed to drive trading, not informed decisions
- 15+ authoritative sources synthesized
- Complete report in about 5 minutes
- Financials computed by code, not AI
- Adjust key valuation sensitivities
- Your personal AI board of directors — choose the model that challenges your thesis best
Per stock analysis compared to manual research
See what EquityDive saves you
Estimate your personal time and cost savings based on your research habits.
≈ $72.12/hr (based on 40-hr work week)
Time you'd spend on equivalent manual research
Report cost: $10 per report (fixed)
Your savings estimate
What's inside your report
Each report typically spans 50+ pages of sourced analysis — here's a sample of what's inside.
Everything you need for due diligence
Professional-grade analysis tools previously available only to institutional investors.
Sector-specific valuation
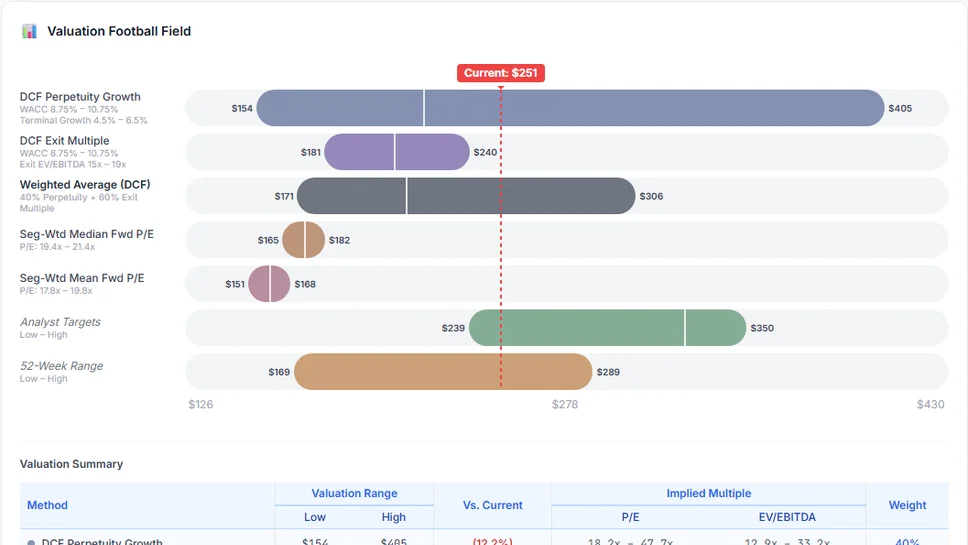
DCF, Dividend Discount Models, and trading comps — each tuned to the sector. Interactive sensitivity tables let you adjust discount rates, growth assumptions, and exit multiples to stress-test fair value.
Competitive & market intelligence
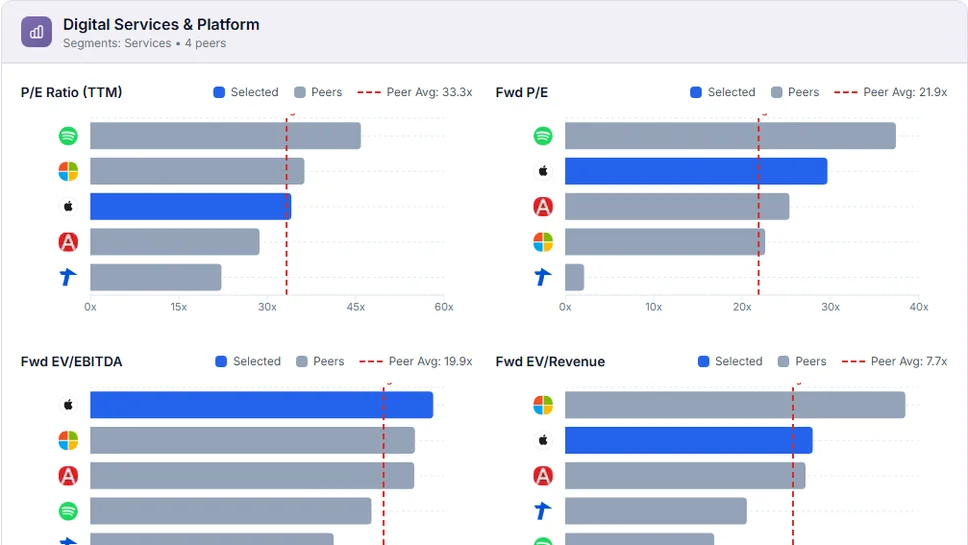
Peer comparison with side-by-side multiples, margins, and growth rates. Porter's Five Forces, competitive landscape analysis, and secular trends — all contextualized to the company.
Risk & catalyst analysis
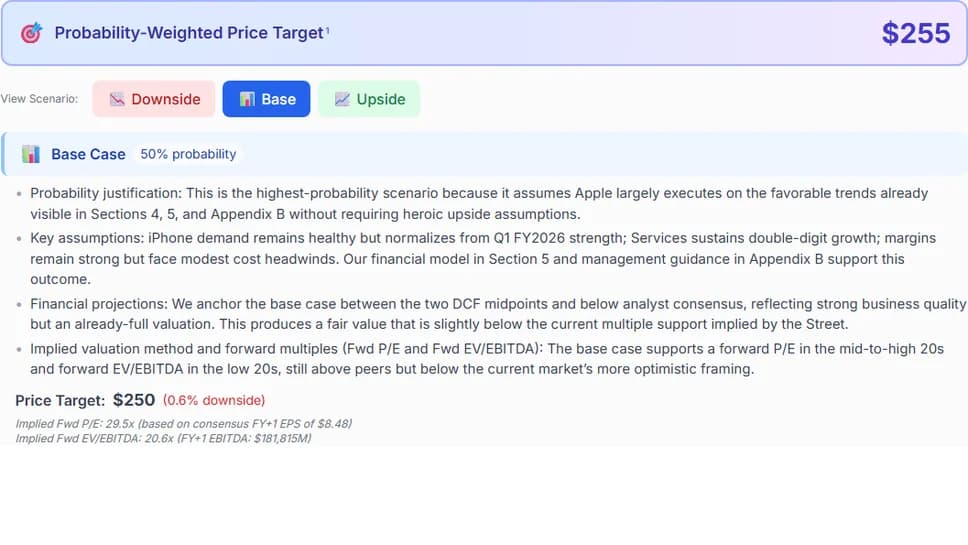
Bull and bear cases, scenario analysis with probability-weighted price targets, catalyst timelines, and sector-specific risk factors with mitigation assessment.
Insider & institutional signals
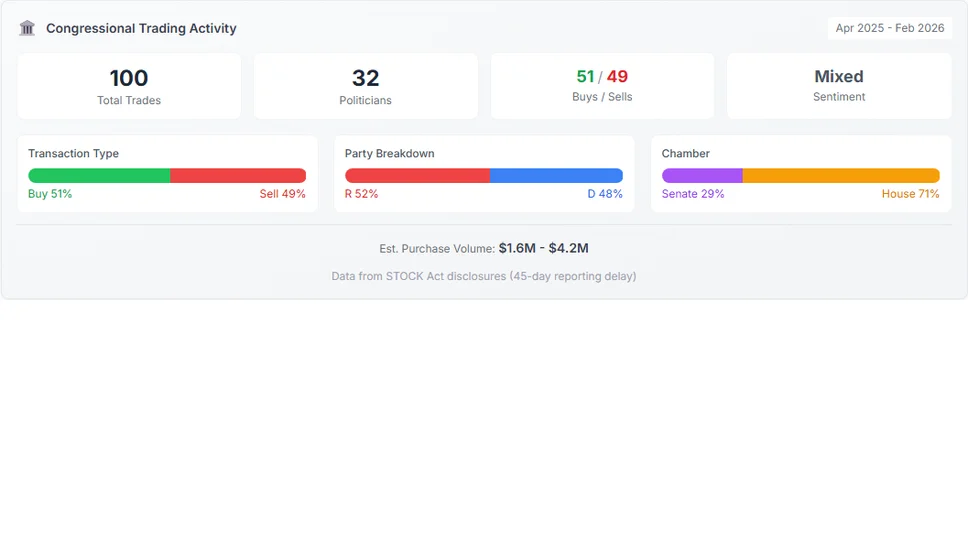
Top institutional holders, recent insider transactions, congressional trading activity, and 10b5-1 plan context — see who's buying, selling, and why it matters.
Your choice of AI model
Different models bring different analytical perspectives to the same data. Compare them like your own board of directors.
Built for accuracy, not just speed
Numbers from code, not AI
All financials, valuations, and calculations are driven by code and sourced from official filings and financial databases. AI handles qualitative synthesis — interpreting competitive dynamics and contextualizing risks — not producing numbers.
Your alpha stays yours
Your research activity stays private. We don't share your watchlist, research patterns, or account data with anyone. No social features, no data brokering, no selling your attention.
Institutional methodology
DCF, Dividend Discount Models, and trading comps follow institutional approaches with transparent WACC calculations. Key valuation sensitivities are visible and adjustable after generation.
Built for how you invest
Whether you're deploying capital or deepening your understanding of what you already own, every investment decision starts with research.
Take control of your own research. Whether you're evaluating a new position, reviewing holdings in your portfolio, or preparing for an earnings announcement — get the comprehensive analysis you need in about 5 minutes.
- Understand complex financials in plain English
- See what a stock may be worth — not just what others say
- Build conviction in your own thesis, not someone else's
From screening new names to validating a thesis, get a comprehensive first pass without the manual work.
- Rapid analysis across any publicly traded U.S. company
- Adjustable valuation sensitivities for your own models
- Transparent methodology you can verify
Make your next investment decision with conviction
Your first report is free. See what on-demand, comprehensive equity research looks like — in about 5 minutes.
Get Started FreeYour research stays private.